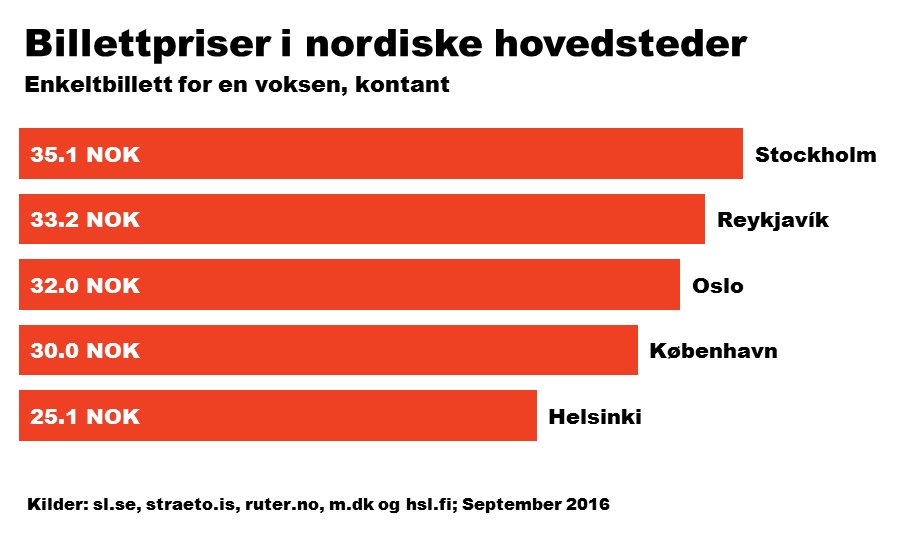
Graphs and Diagrams That Grab Attention
An outstanding diagram says more than a thousand words. Therefore it is a big advantage to include professional looking charts and graphs into your annual reports, webpages and other articles. We offer everything from graph- and diagram templates to customized, ready-to present charts. Of course, we pay high attention to your corporate identity and adapt colors and fonts accordingly so that your graphics fit your purpose.
All diagrams we deliver are tailor-made for you. Tell us what you would like to own and we will deliver a result that exceeds your expectations.

Pivot Charts – Effective and Fast Data Analysis
Pivot charts are interactive diagrams that allow you to analyze large amounts of data in a quick and easy manner. Pivot charts allow you to sort, filter or group your data with just few clicks. You can also easily summarize your data and display sum, average, count and many more values with little effort. We are looking forward to set up effective pivot charts that will save you a lot of time.

